In this test, we will try to see the performance improvement of using dual mode in a Power BI dimension table using a cloud database and a shared dataset, so we don’t get the performance issues experienced in the first dual mode test on a laptop.
Test 1
In the first test, we will use a single dimension table to test and a single fact table set to direct query mode.
I will use a public dataset from Google BigQuery.
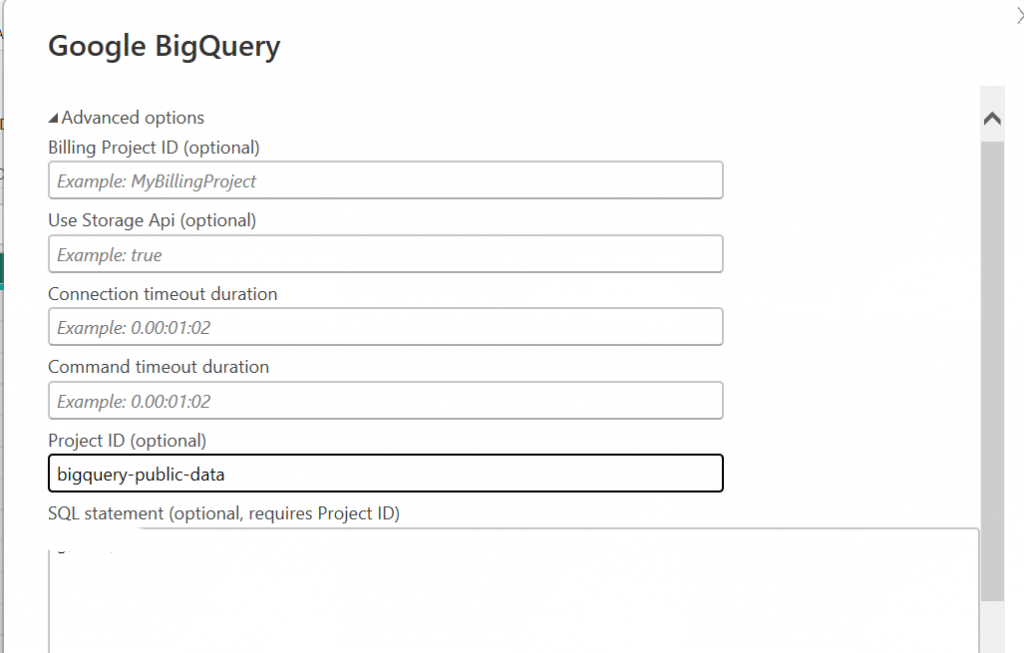
Get Data > Google Big Query. I enter the project ID and am prompted for my Google login.
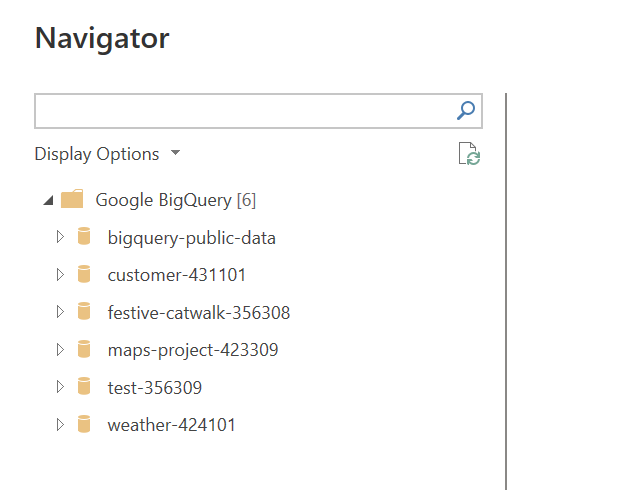
I can then navigate to the dataset I want to work with.
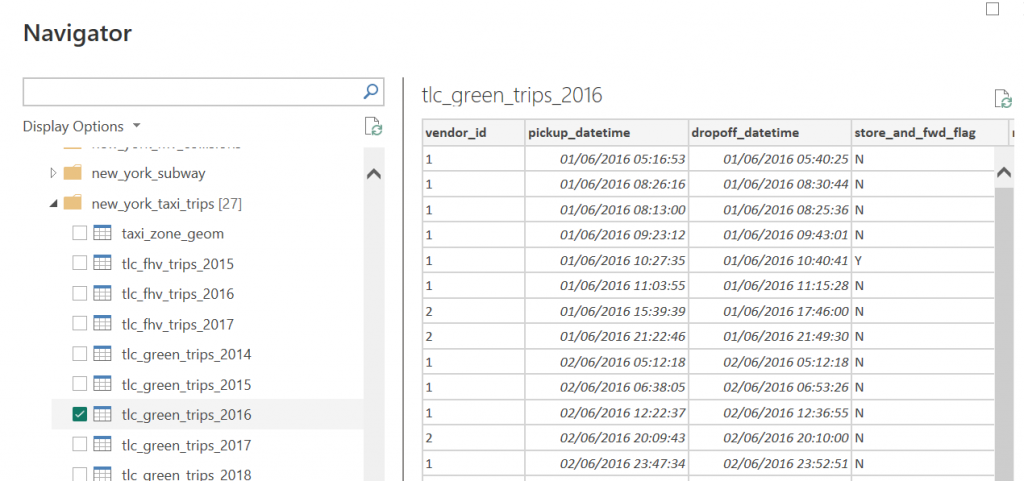
We choose a table from the New York taxi trips dataset, which has over 16 million rows.
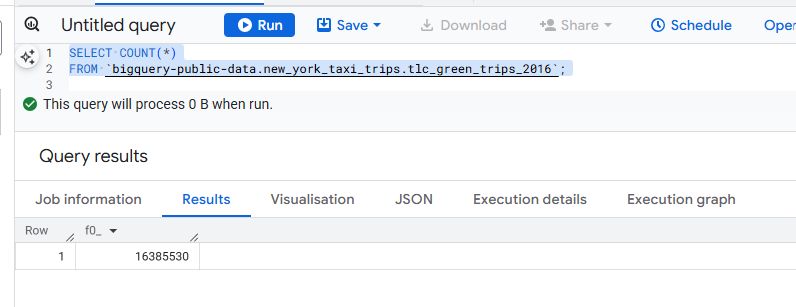
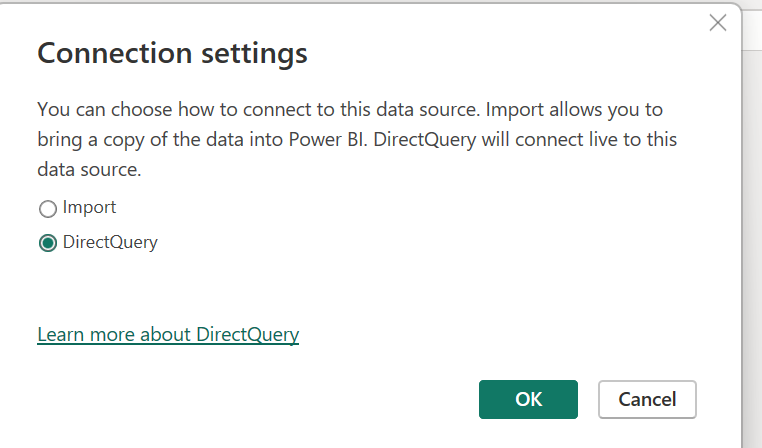
This is configured with a Direct Query connection.
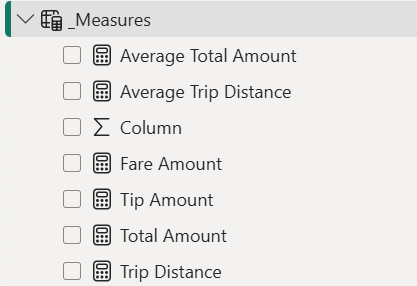
I will then add some simple measures for testing as follows:
Next, we’ll add the tax-zone_geom as a dimension table and add it with Direct Query mode initially. It has 263 rows.
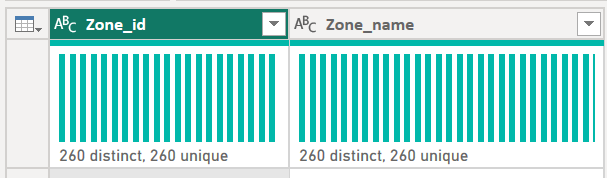
I find there are duplicates in my dimension, which is a pain, so I need a new view in BigQuery to fix this.
I will create a simple view as follows (replace myproject_id with your own):
CREATE OR REPLACE VIEW `customer-myprojectid.pbitesting.DimZone` AS
SELECT
DISTINCT Zone_id, Zone_name
FROM
bigquery-public-data.new_york_taxi_trips.taxi_zone_geom
I can then connect Power BI to BigQuery using the different ProjectID and select my de-duped dimension table.

Next, I change the zone_id and pickup_location_id fields to whole numbers to save space.
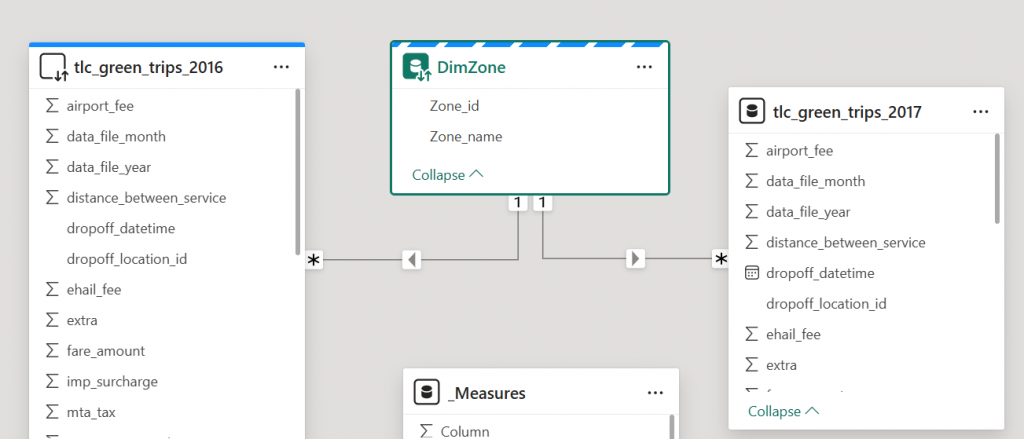
I will then connect my DimZone table with my tlc_green_trips_2016 table using zone_id and pick_up_location_id.
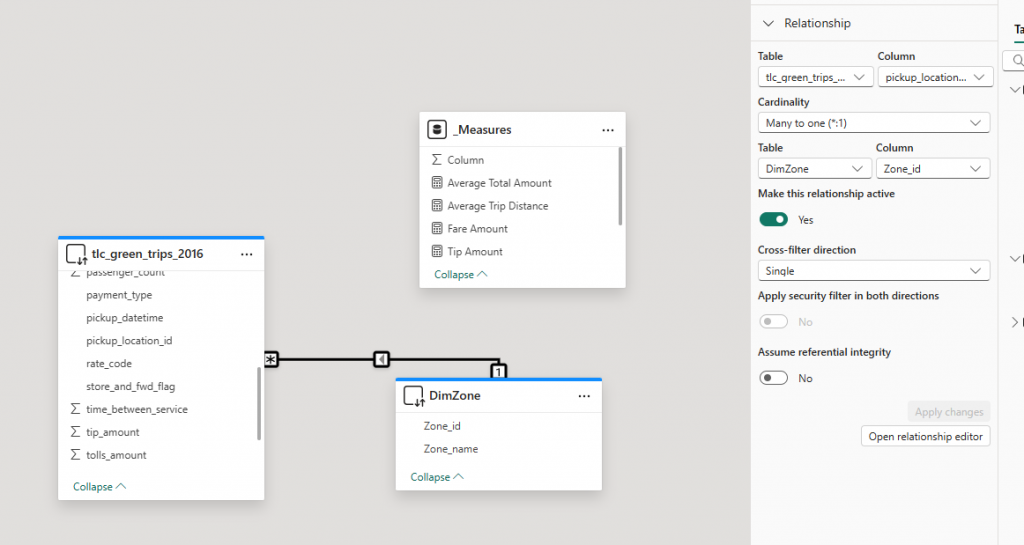
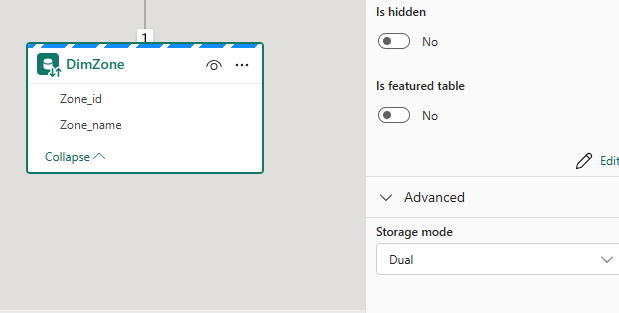
I then changed my tax_zone_geom table to dual mode.
Then I publish my dataset to the Power BI service and we can connect to it with a new report.
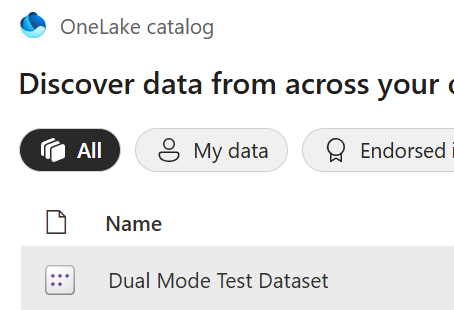
Get Data > Power BI semantic models >
When I try to connect, I get the following BigQuery authentication error:
DataSource.Error: ADBC: The service bigquery has thrown an exception. HttpStatusCode is Unauthorized. Request is missing the required authentication credentials. Expected OAuth 2 access token, login cookie, or other valid authentication credential
So I need to add the credentials for accessing BigQuery to my dataset as follows in the dataset settings, and then I will need to sign in with my Google Account.
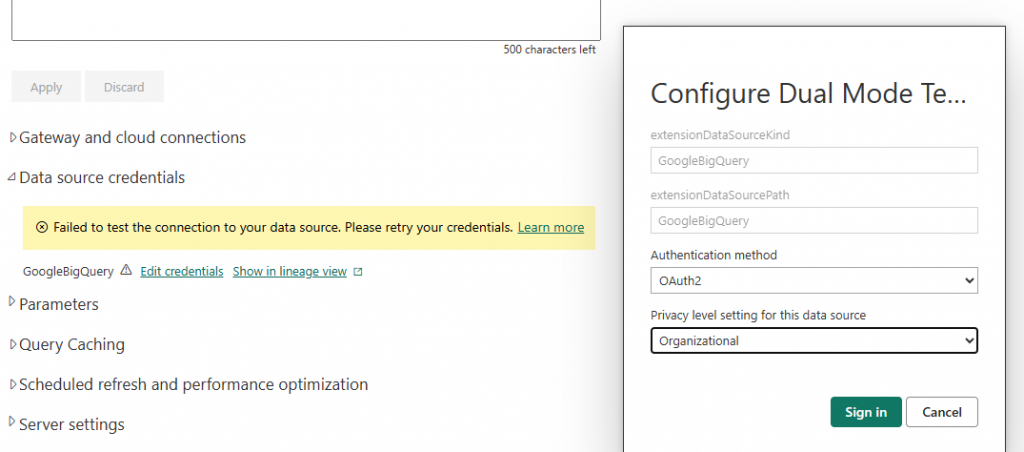
My settings then look like this:

I can then return to my Power BI Desktop report and connect to my semantic model.
I can now view the tables in my shared dataset.
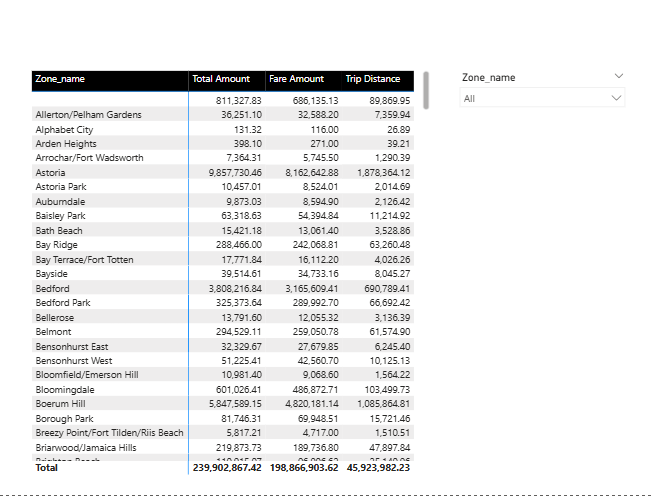
I can then build a simple matrix with my measures from my tlc_green_tips_2016 fact table and the Zone_name from my dimension table, as well as adding a Zone_name slicer to my model.
It takes about 40 seconds to load.
Initial testing results are interesting. Even though caching is switched off in the dataset, we still see caching on testing with performance analyzer. Apparently this is due to session level caching, which can’t be switched off.
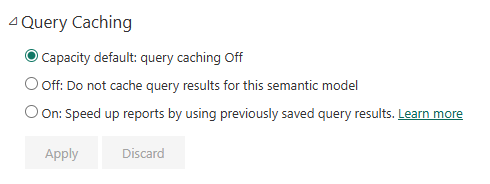
We didn’t see the session-level caching in the previous test, so we will have to select different selections each time to do the dual mode via import mode test. Also, we can’t do the full table test as this is also impacted by session-level caching.
In the first test, we will use a one-dimensional table and a fact table in direct query mode. We will test the dimension table in dual mode and then in import mode, and see the impact on performance.
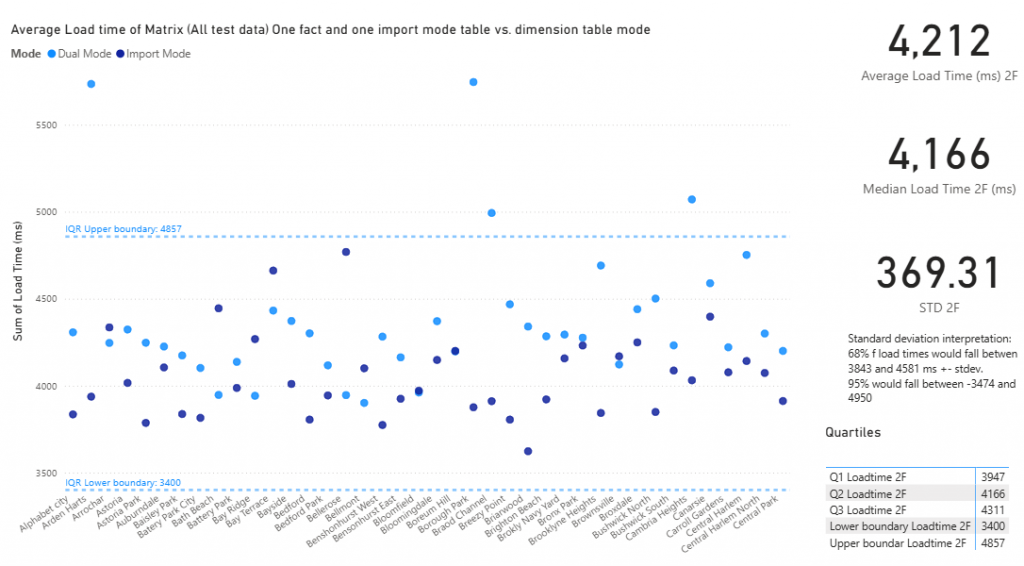
Dual Mode Test 1 Results: 1 Dimension Table and 1 Fact Table in Direct Query Mode
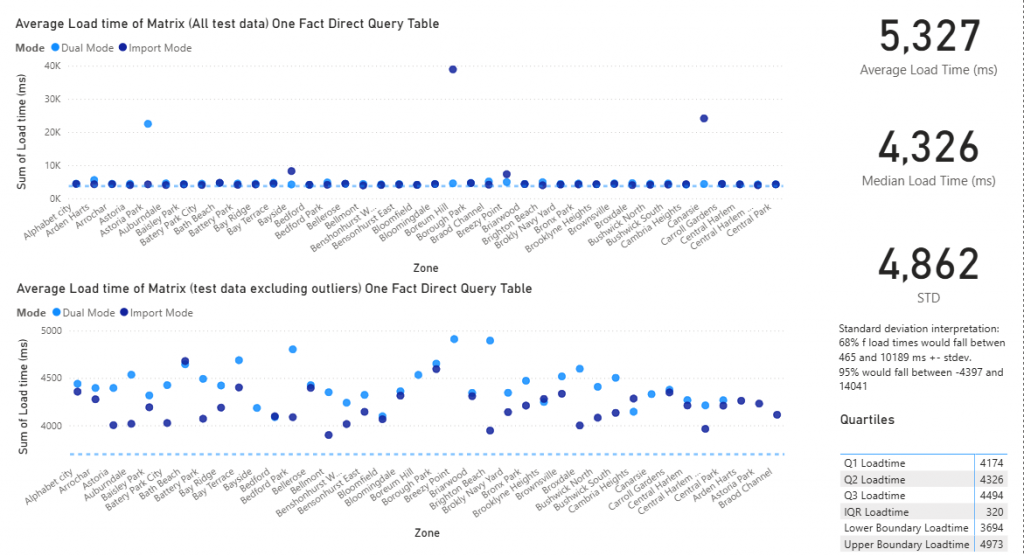
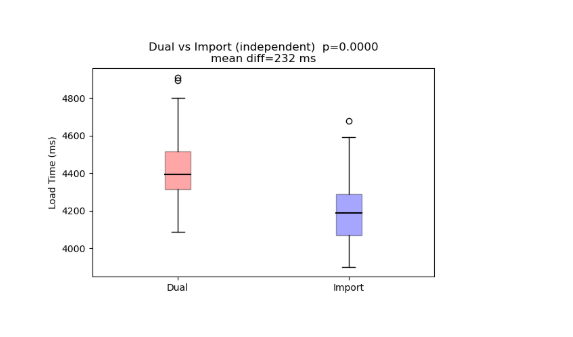
After excluding outliers, we can see the import mode is trending faster than the dual mode.
After outliers are removed, which look more like anomalies due to resource limitations, rather than as part of the norm,
the T-test shows a significant difference between the 2 sets of observations.
Test 2
In the next test, we will test dual mode and 2 different fact tables. One is in import mode and the other is in direct query mode. This is where we should see the performance improvement of using dual mode.
We start by adding an additional fact table to the model, but this time in import mode.

The tlc_green_trips_2017 table. This table is 12.7M rows.
Then I rebuild the model. The 2016 is in direct query mode, the DimZone table is in dual mode, and the 2017 table. I then add some additional measures for each table to use in the Matrix test.
My new test matrix now has some measures from both my fact table 2016 (import), 2017 (direct query)
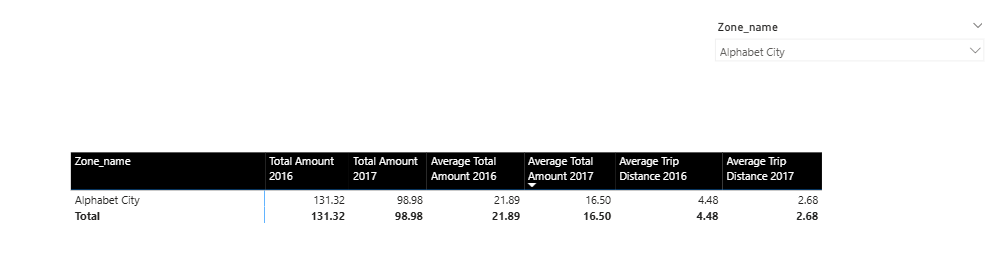
Test Results:
The trend appears to favor the import mode again, which was kind of disappointing as i wanted to see a similar improvement as i saw using SQL server locally.
Running a Test using Python in Power BI
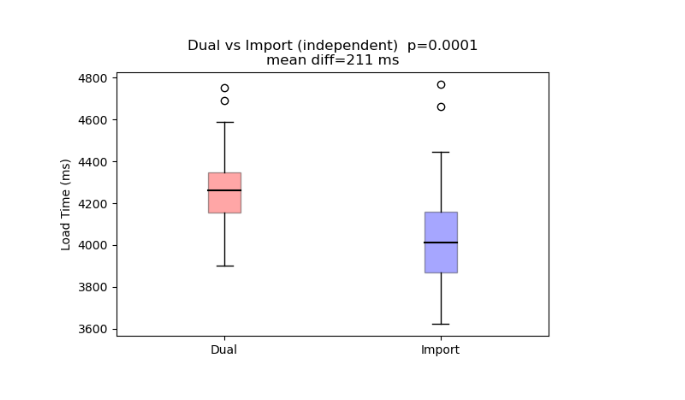
We can use the Python visual to create some Python graphs and a T-Test.
I use AI to generate the code for me, and i add it into the Python script editor.
And i add the Zone, mode, and load time to the value wells of the visualisations pane.
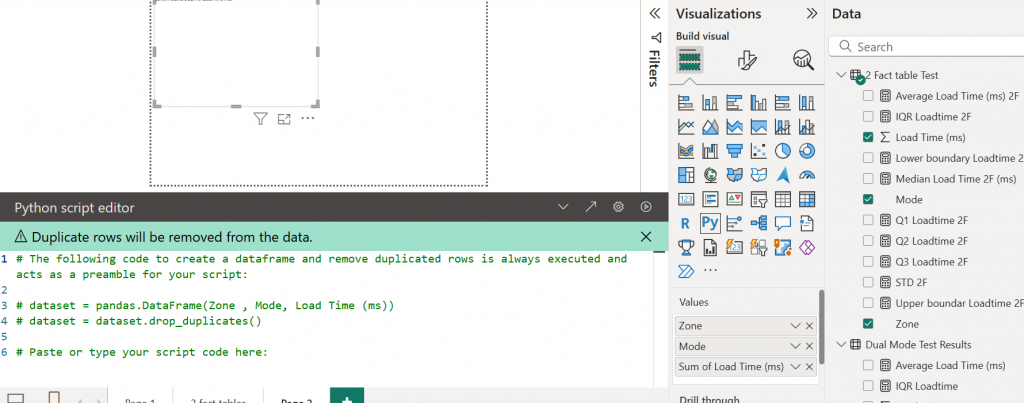
The results are shown below, above the box plot, with the p-value = 0.0001 or a 1 in a thousand chance of this happening by chance. It seems that import mode is faster again. Perhaps BigQuery doesn’t work as well. It seems testing is the only way of finding out. Models may be faster in some circumstances than in others.